Starting Your First Function
1. Choose a Template: Leverage Your Created Template
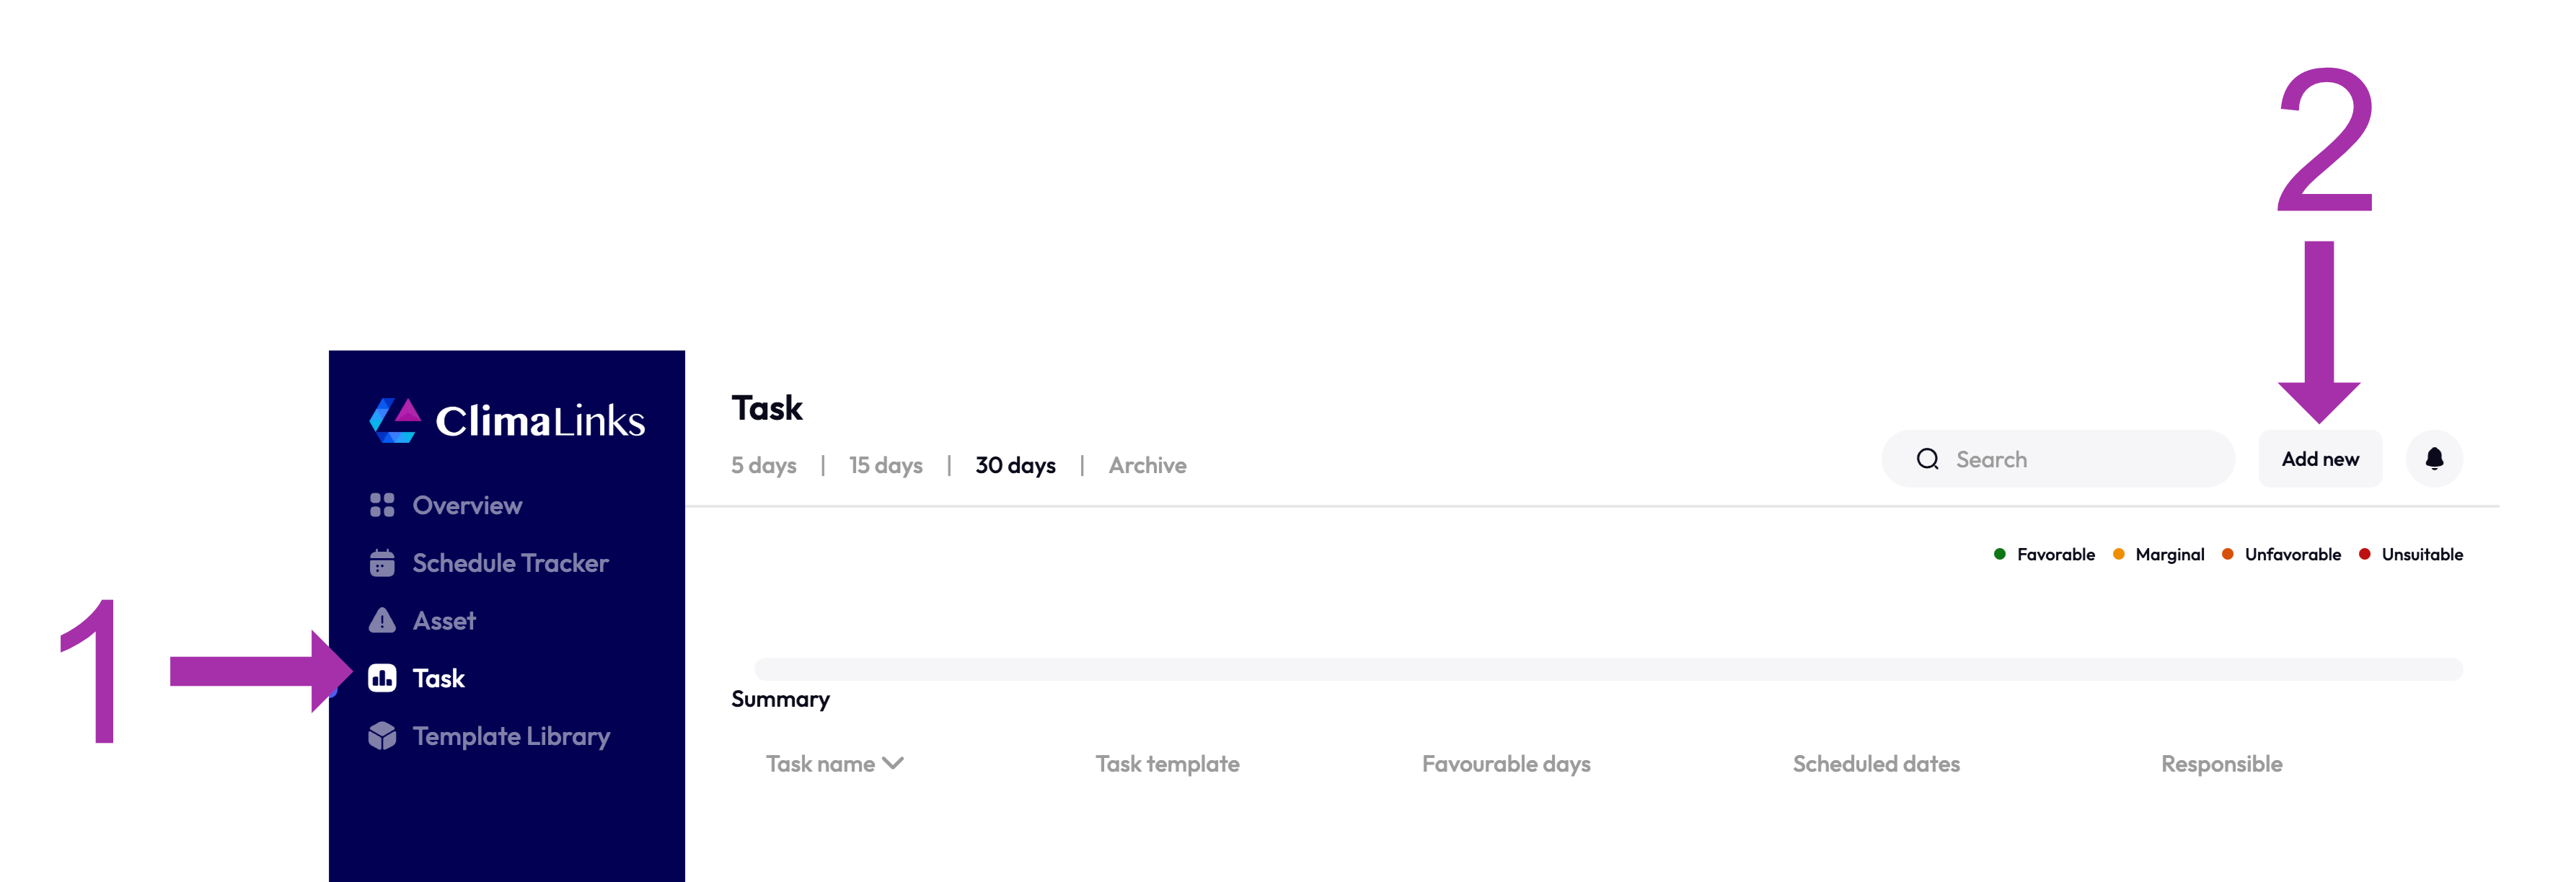
- Navigate to the Task Tab: Click "Add New" on the top right corner. Search the library for your template, utilizing keywords or the title for quick access. Remember, each task references the information in the template library, allowing you to create multiple tasks from the same template. Should the template need adjustments, you can modify the template variables directly, never the task itself.
2. Assign Responsibility: Ensure Every Task Has a Leader
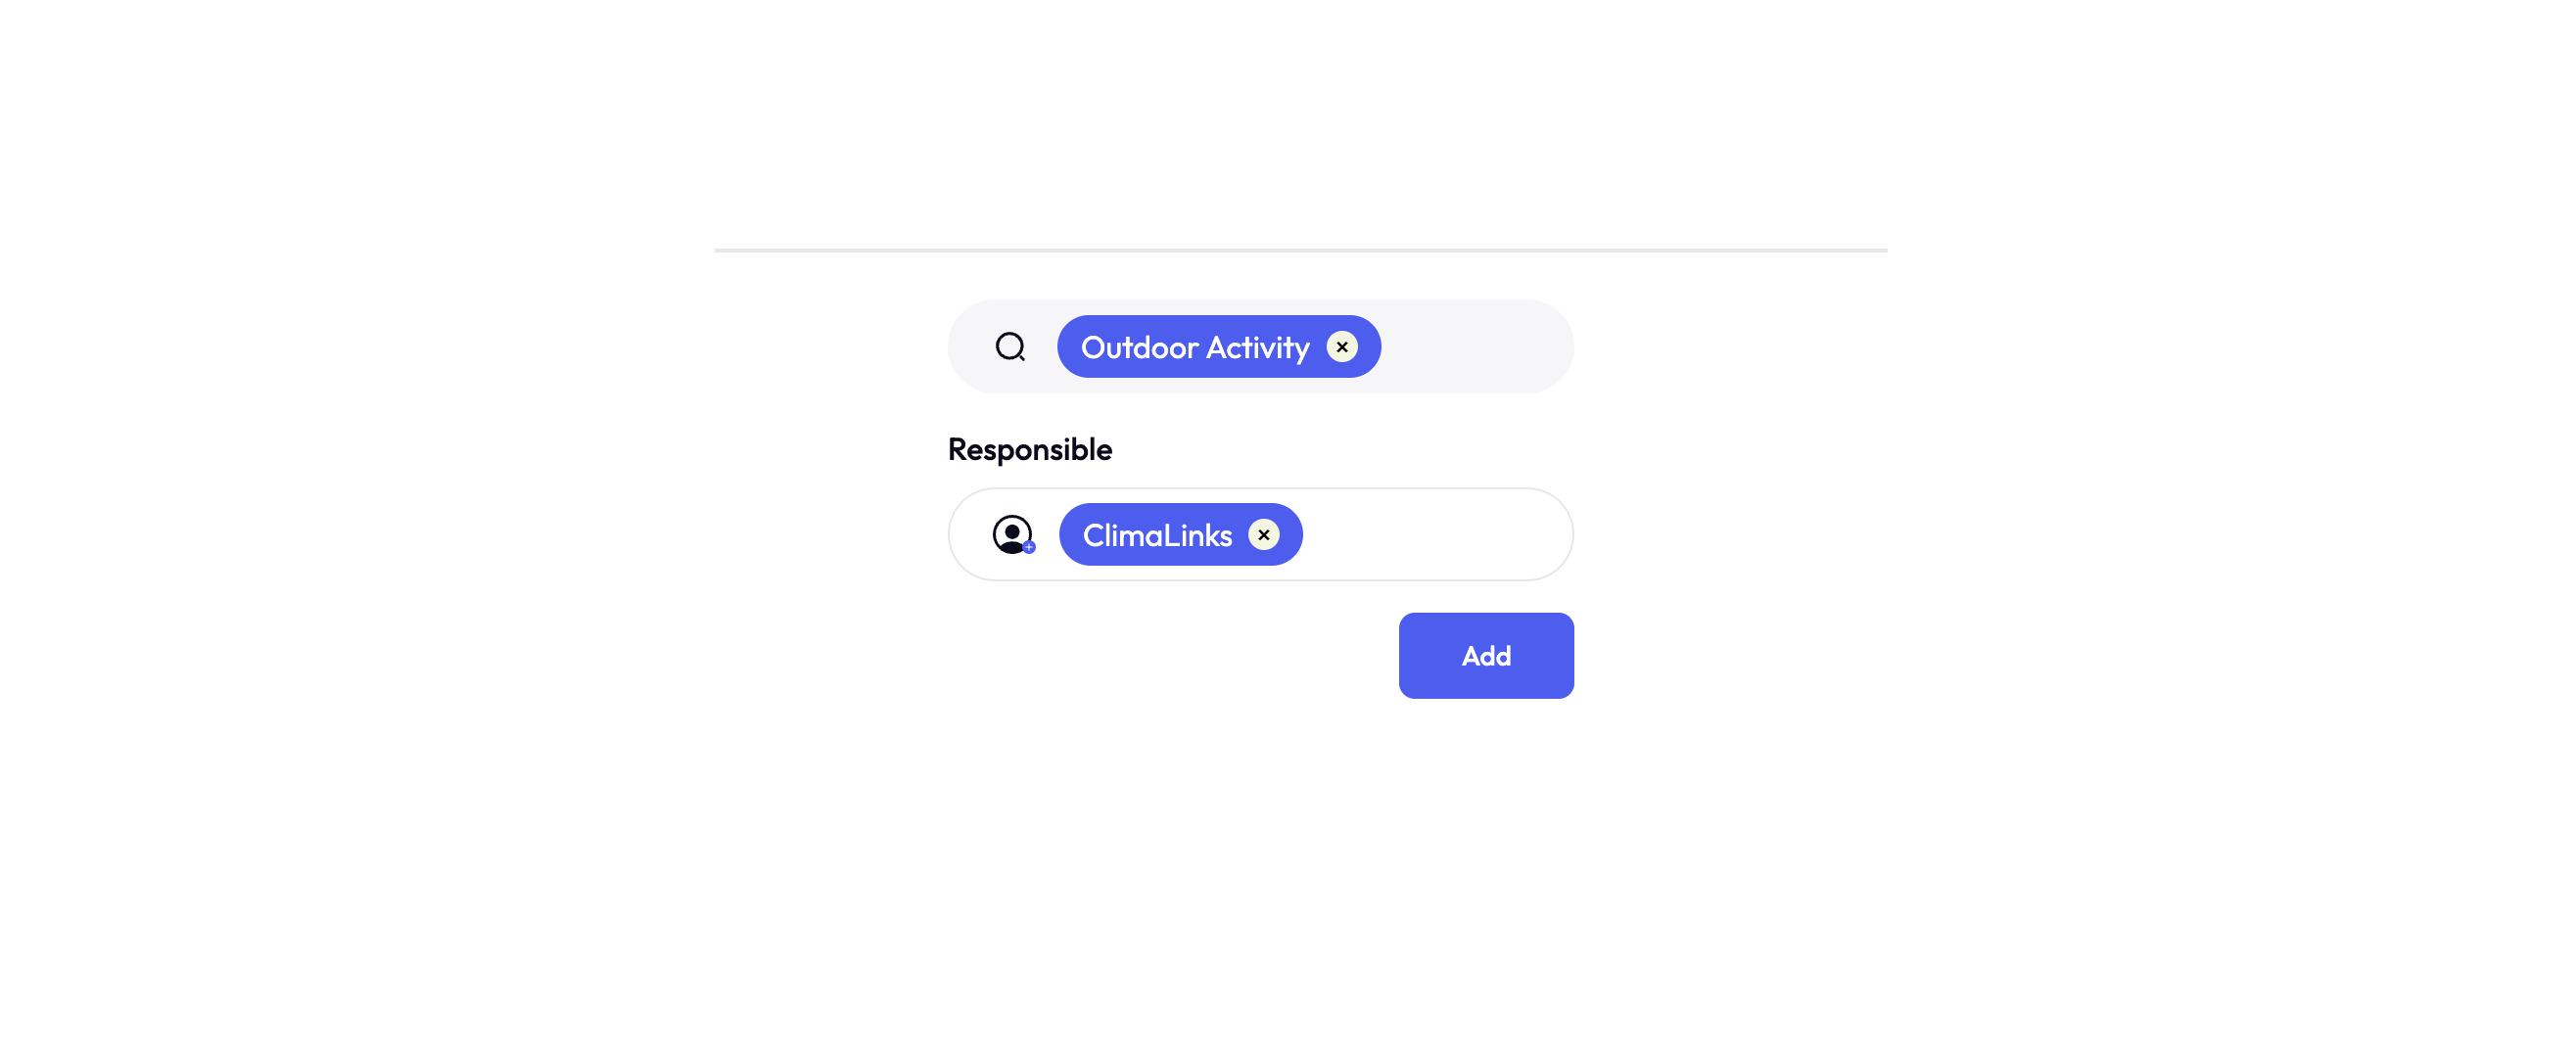
- Select Your Task: Once you find your template, select it. A golden rule: always assign someone responsible for the task. This person can be changed at any time before the task is scheduled, ensuring flexibility in task management.
SIDE NOTE: Task vs. Task Template: Clarifying Concepts with Visuals
- Understand the Difference: It's crucial to grasp the distinction between a task and its template. A task is an instance that utilizes the settings from a template. This distinction helps in managing tasks more effectively.
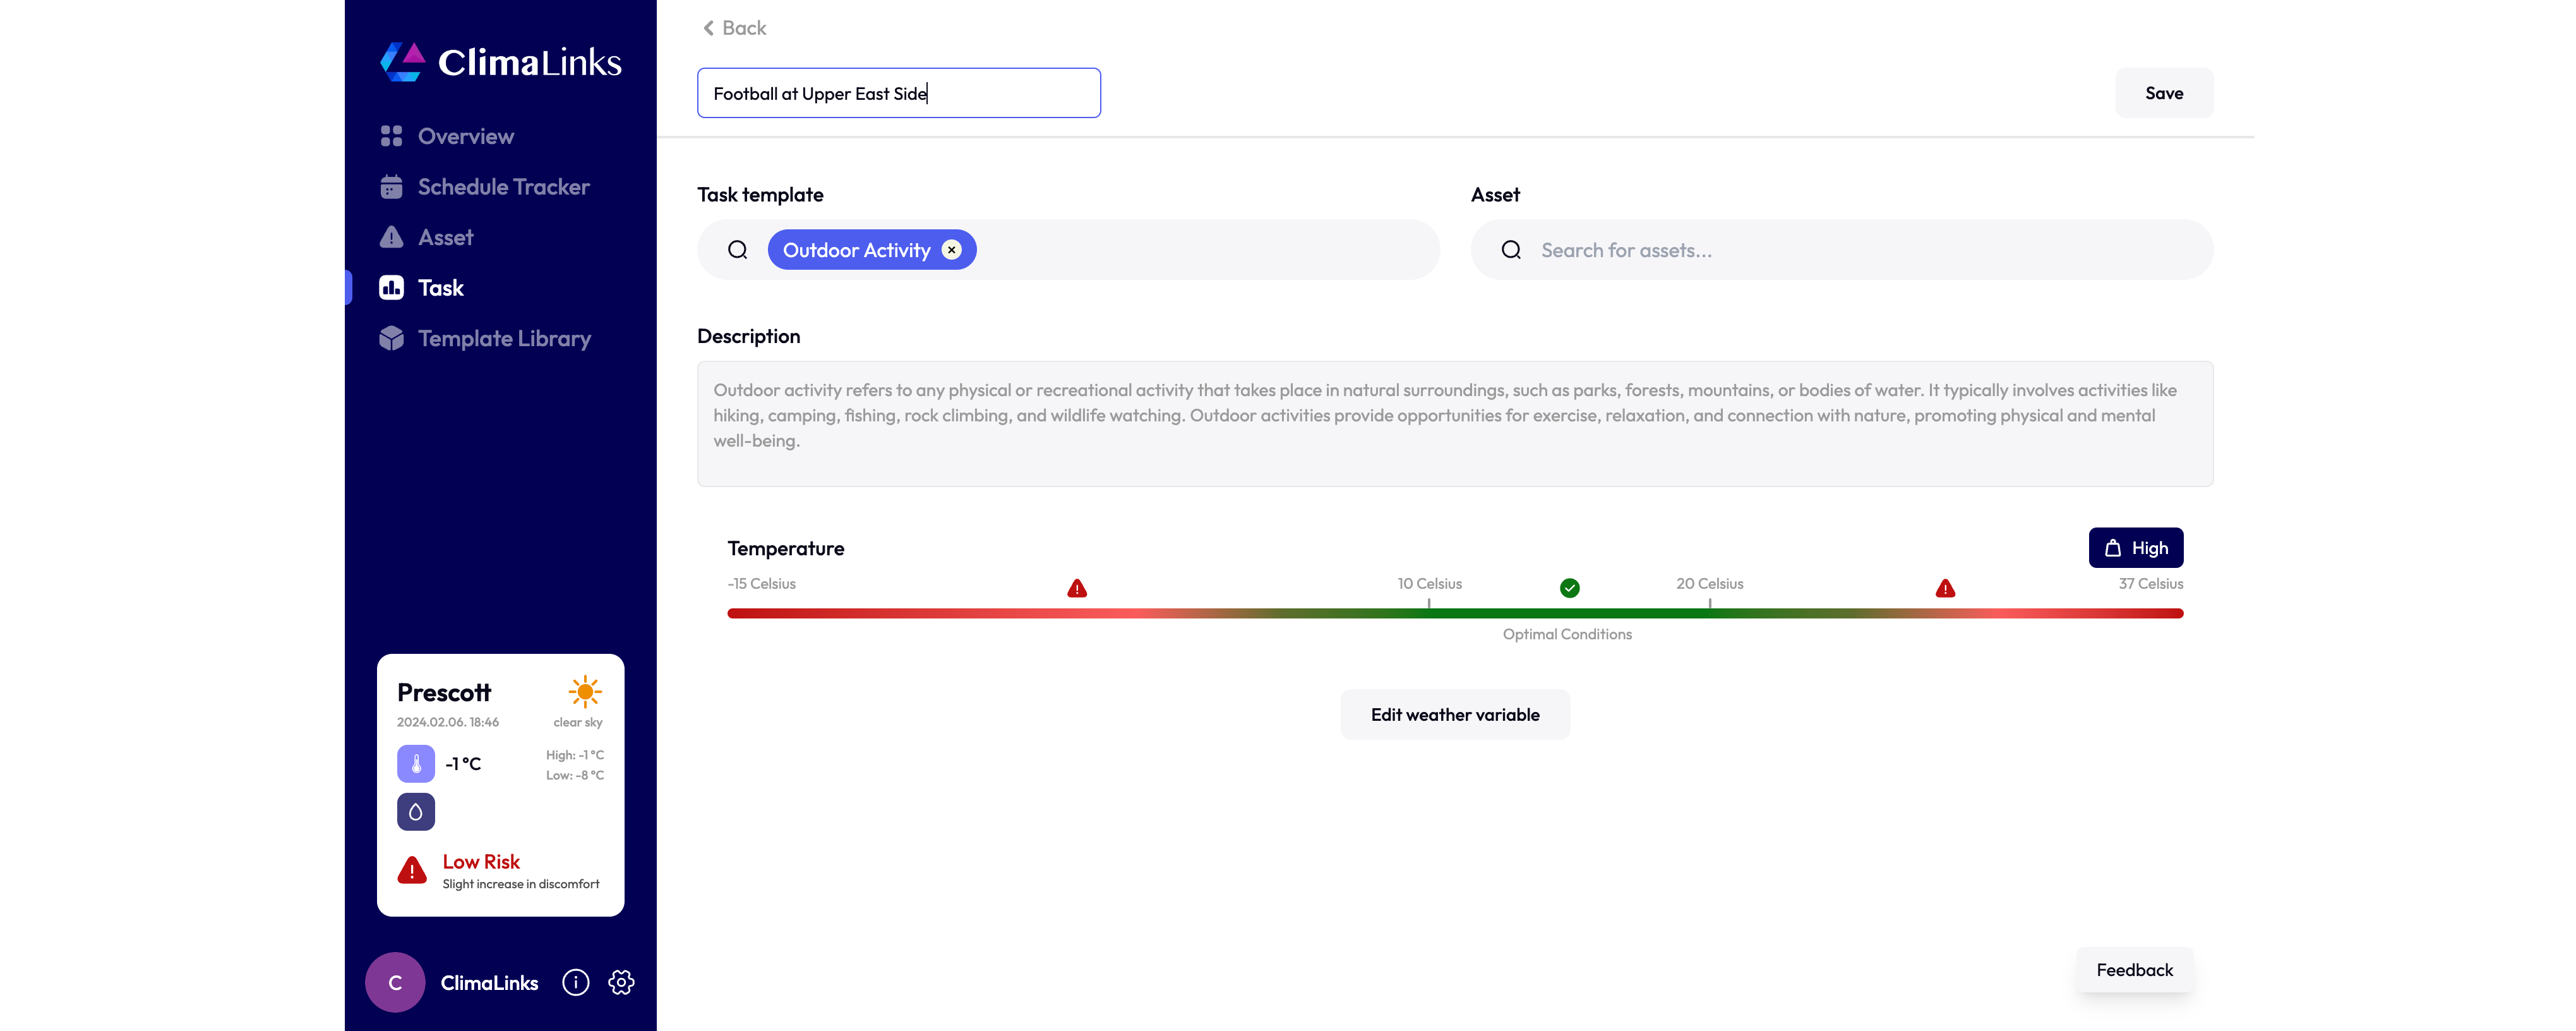
3. Filling in the Required Information: Detailing Your Task
-
Name and Describe Your Task: Assign a unique name to each task, which can be the same as or different from the template name. The task template is automatically tagged underneath to provide clarity and reference. Attach any relevant assets to the task here, though for this guide, we won't include any.
-
Check Weather Variables: The weather variables from your template are visible for a final review on this page. If adjustments are needed, use the 'Edit Weather Variable' button for quick edits.
4. Entering the Detail Page: Navigating the Task's Heart
- Save and Explore: Upon saving, you'll enter the task's detail page, one of the most utilized sections of the WRM. A notification (toast) on the bottom right will inform you about platform actions like calculations or saving progress.
Key Aspects of the Detail Page:
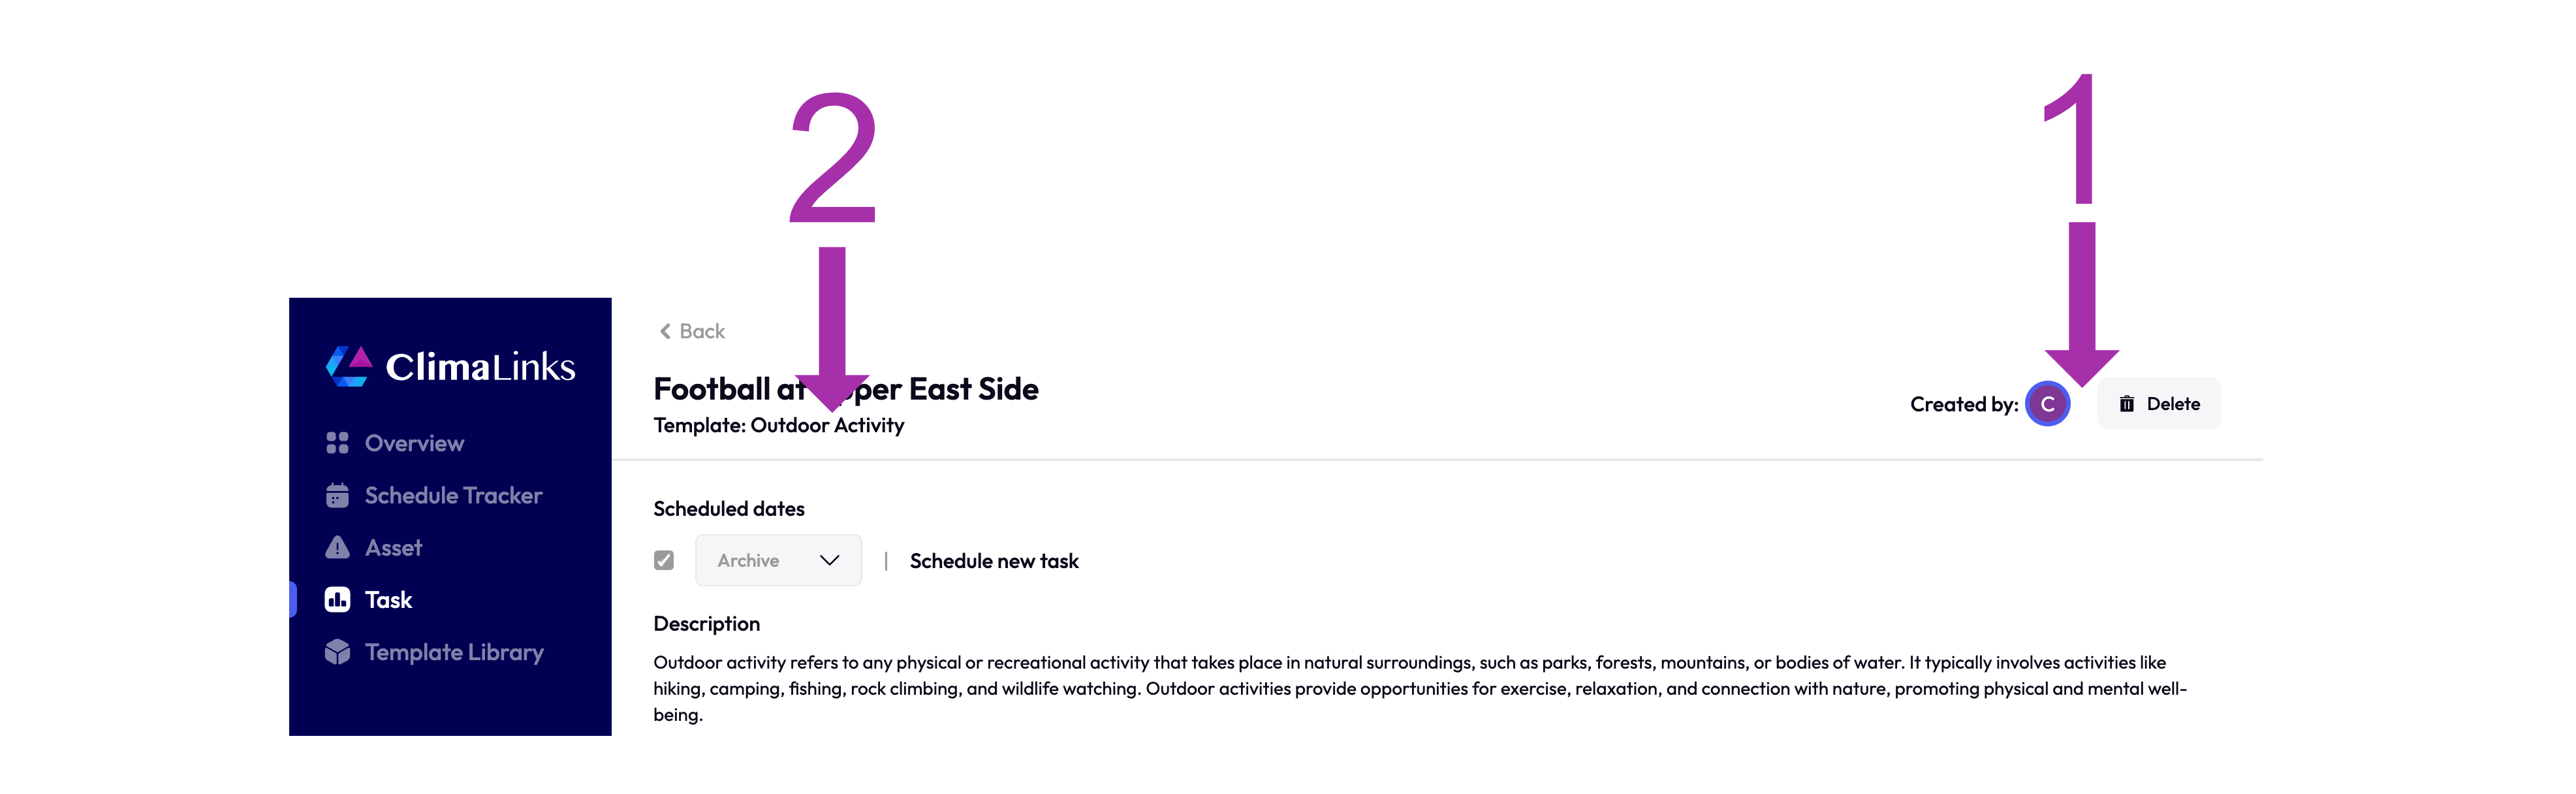
- Creator and Deletion Options: Located at the top right, allowing for easy task management.
- Template Reference: Directly under the task title, for quick edits to variable ranges.
- Core Areas: The calendar, the line graph, and the detailed breakdown, each offering insights into task planning.
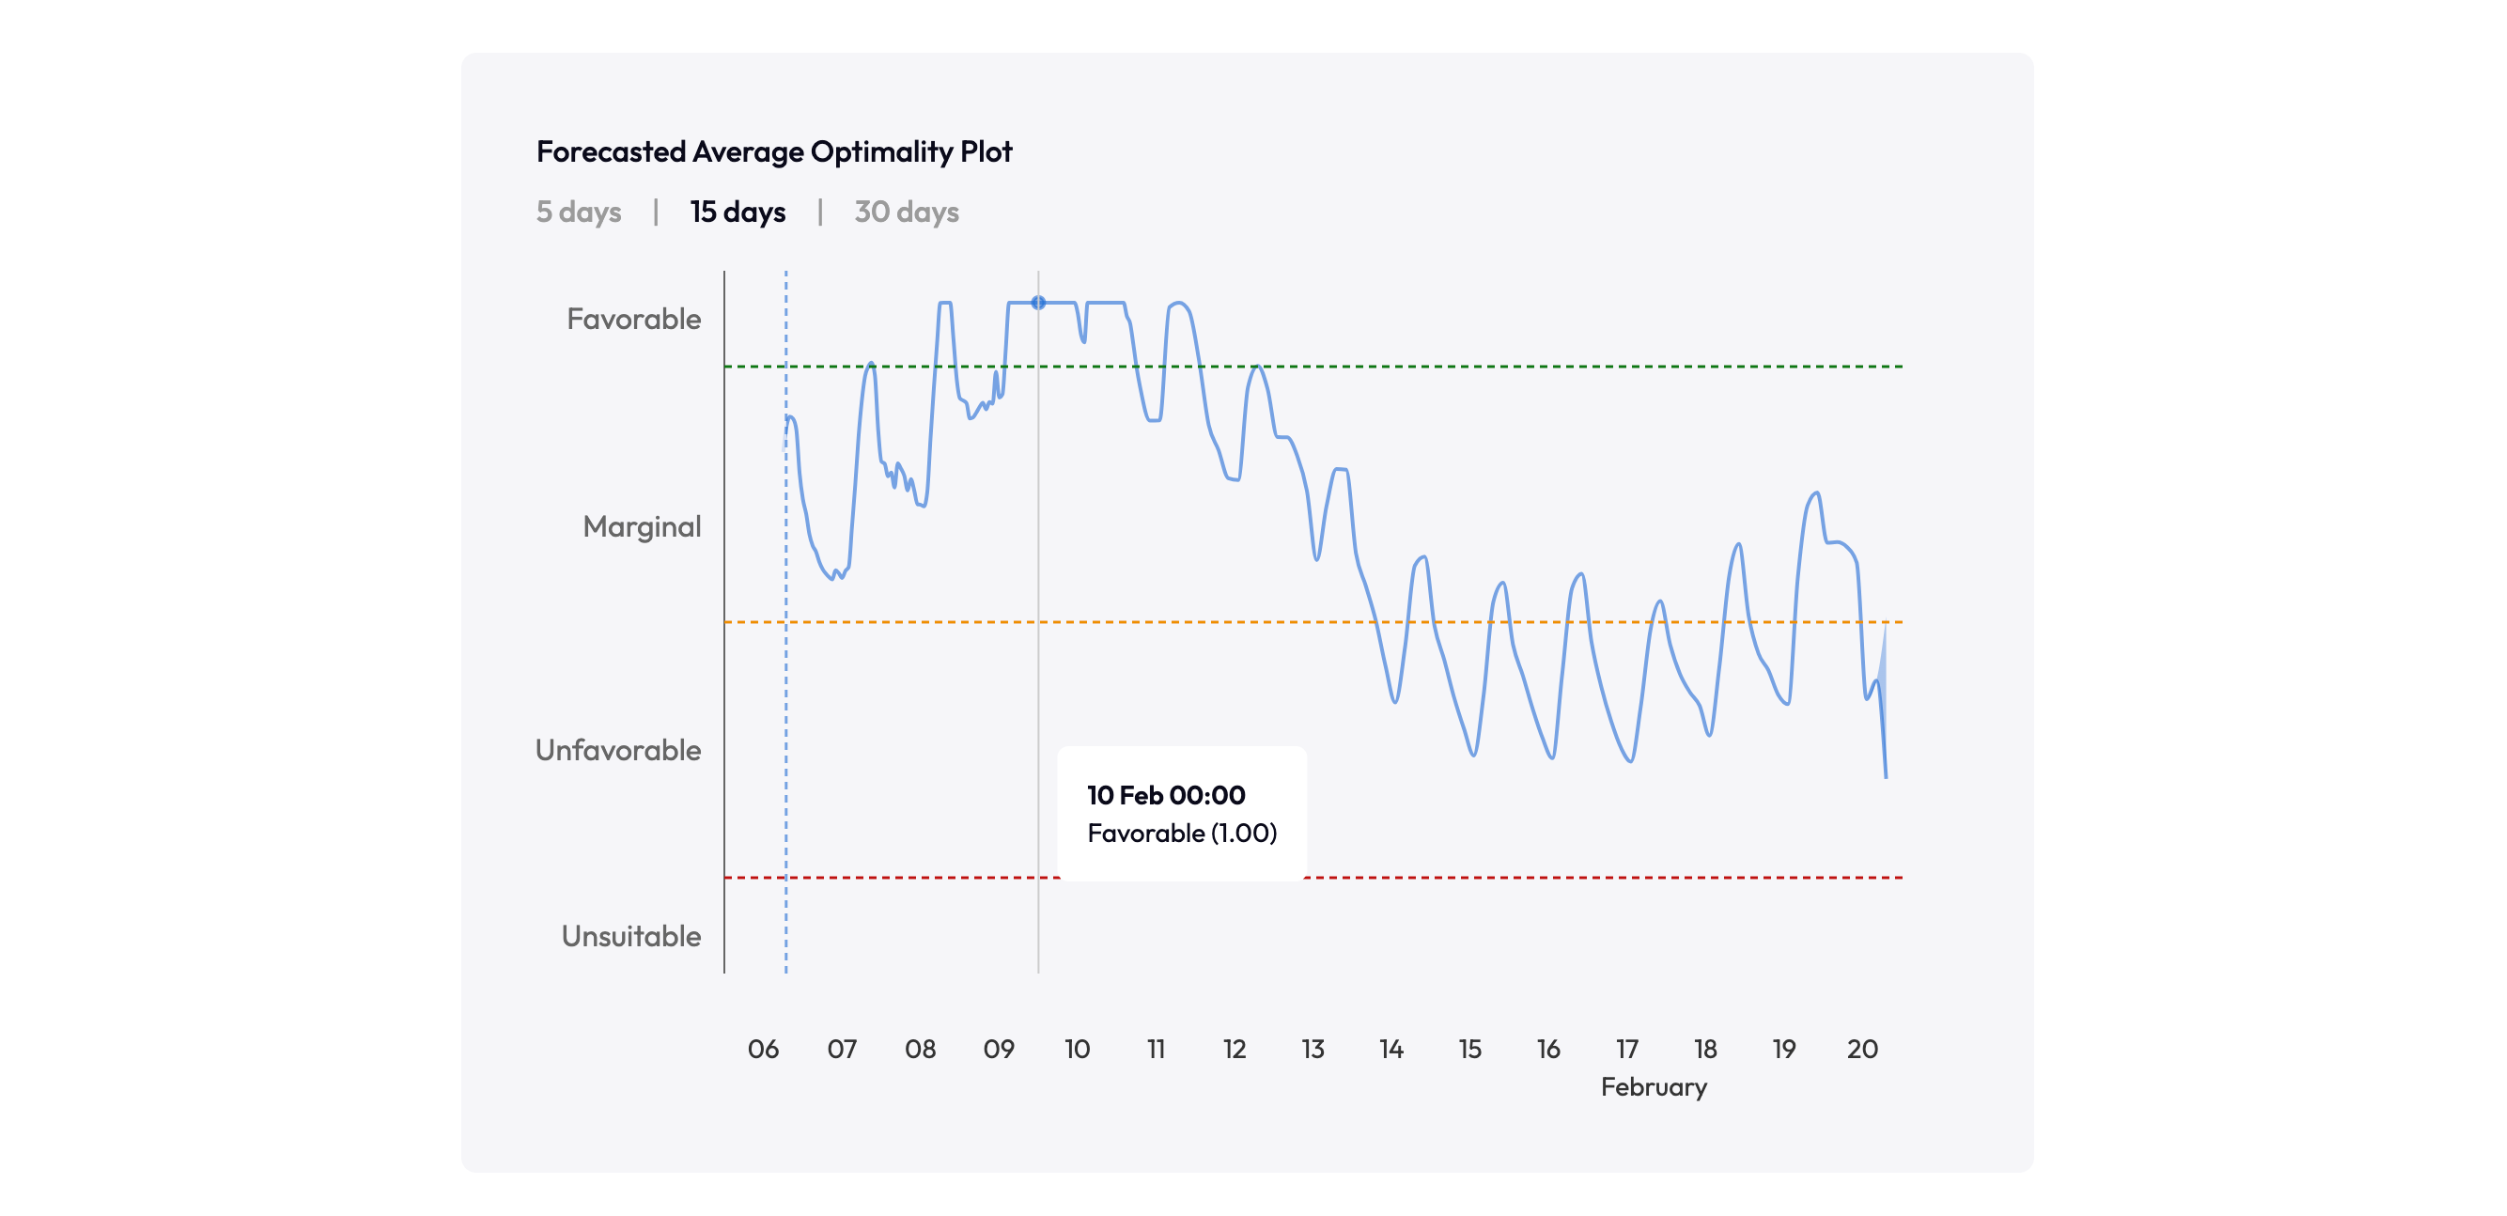
5. The Line Graph: Visualizing Task Feasibility
-
Understanding Fluctuations: The line graph is not just a visual aid but a strategic tool, showcasing the average optimality value across available time steps. Notice the natural variance in weather conditions, such as diurnal temperature changes or sudden shifts in cloud cover. These fluctuations are a part of your planning landscape.
-
Ensemble Forecasts Explained: From day 15 onwards, the graph introduces shading to represent ensemble forecast ranges. This means ClimaLinks runs the weather model 50 times to calculate a spread of possible outcomes. The shading indicates the 10th to 90th percentile ranges, offering an 80% confidence interval for planning. The median line, potentially off-center, guides you towards the most likely scenario, enabling informed decision-making.
-
Interactive Insights: Hover over the graph for precise values at any given time step, transforming abstract data into actionable intelligence.
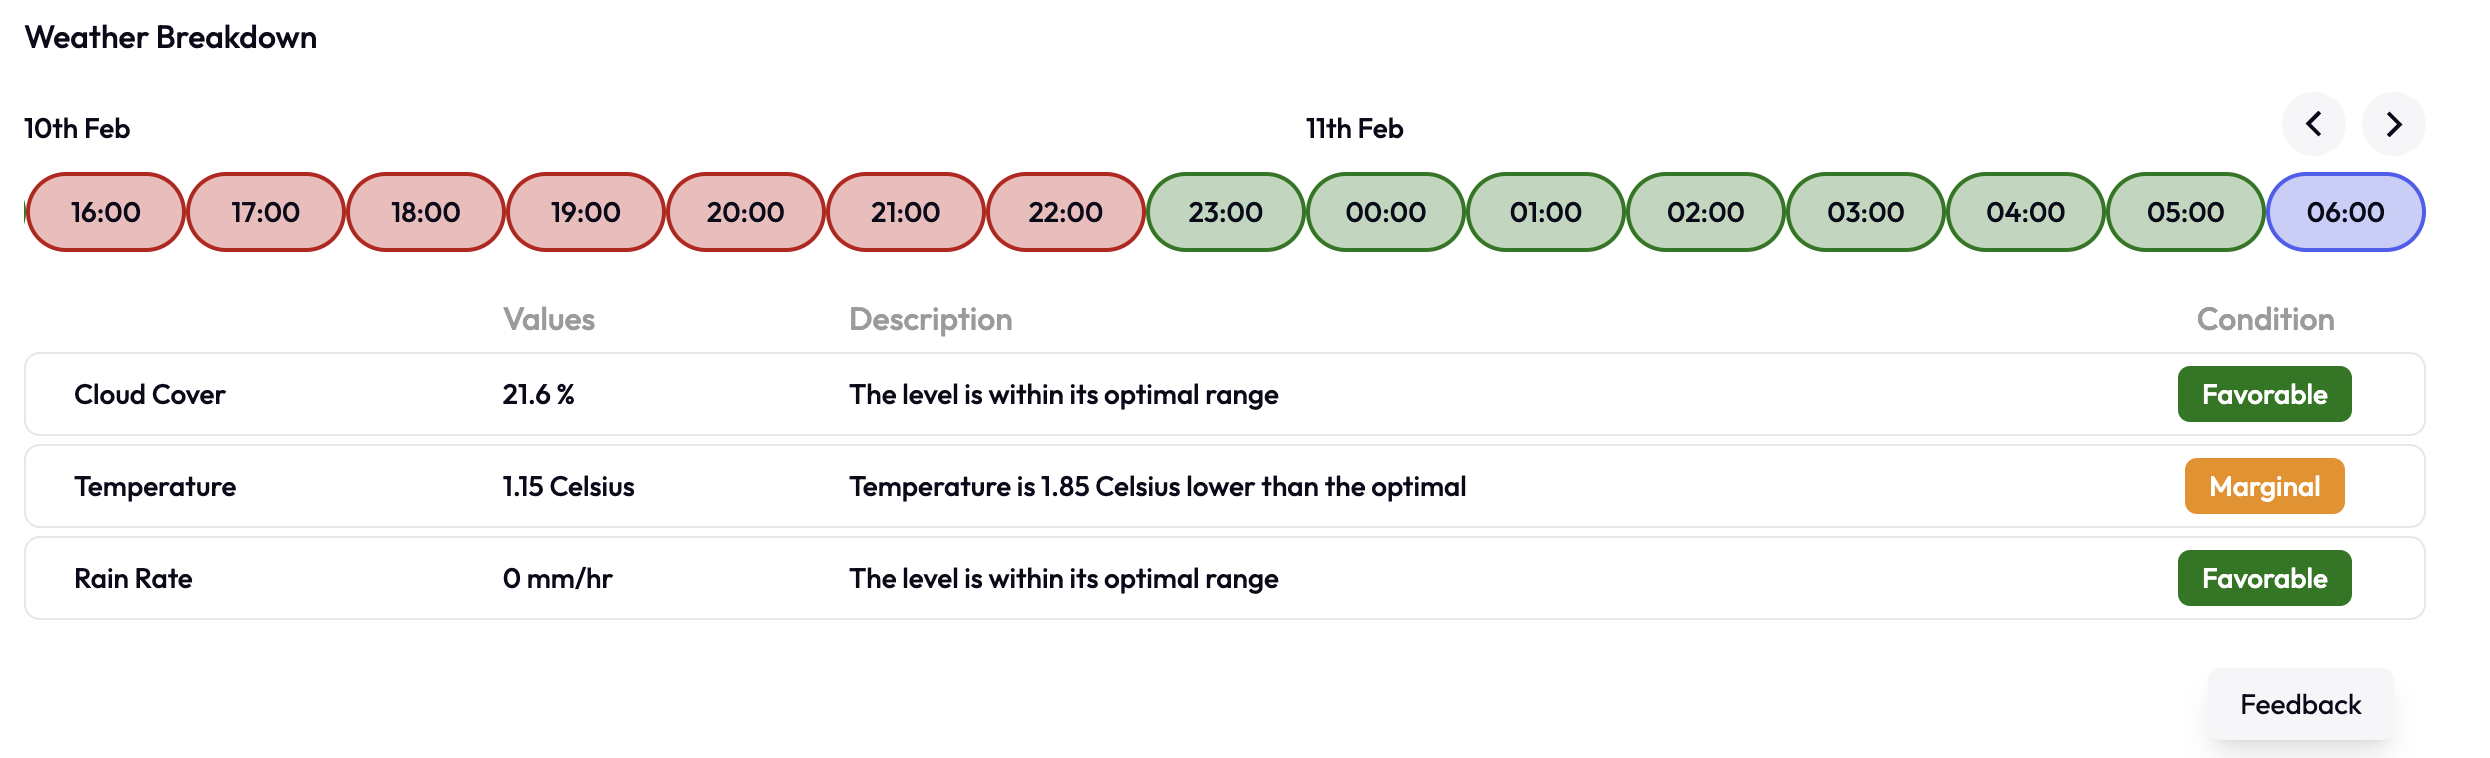
6. Breakdown Area: Deep Dive into Variables
-
Variable Impact Exploration: Delve deeper into how each weather variable influences your task's viability by analyzing the breakdown section. By clicking on the line graph or navigating through hourly timestamps, you're presented with a detailed view of each variable's performance against your predefined conditions.
-
Optimality and Acceptability: For each variable, you'll find its raw value alongside an analysis of how it fits within your acceptable and optimal bounds. This section also tags conditions for quick reference, making it easier to spot perfect or problematic weather conditions at a glance.
-
Strategic Decision Making: Use this breakdown to pinpoint the ideal day for your task. It provides a clear, comprehensive view of the weather landscape, aiding in your scheduling decisions.
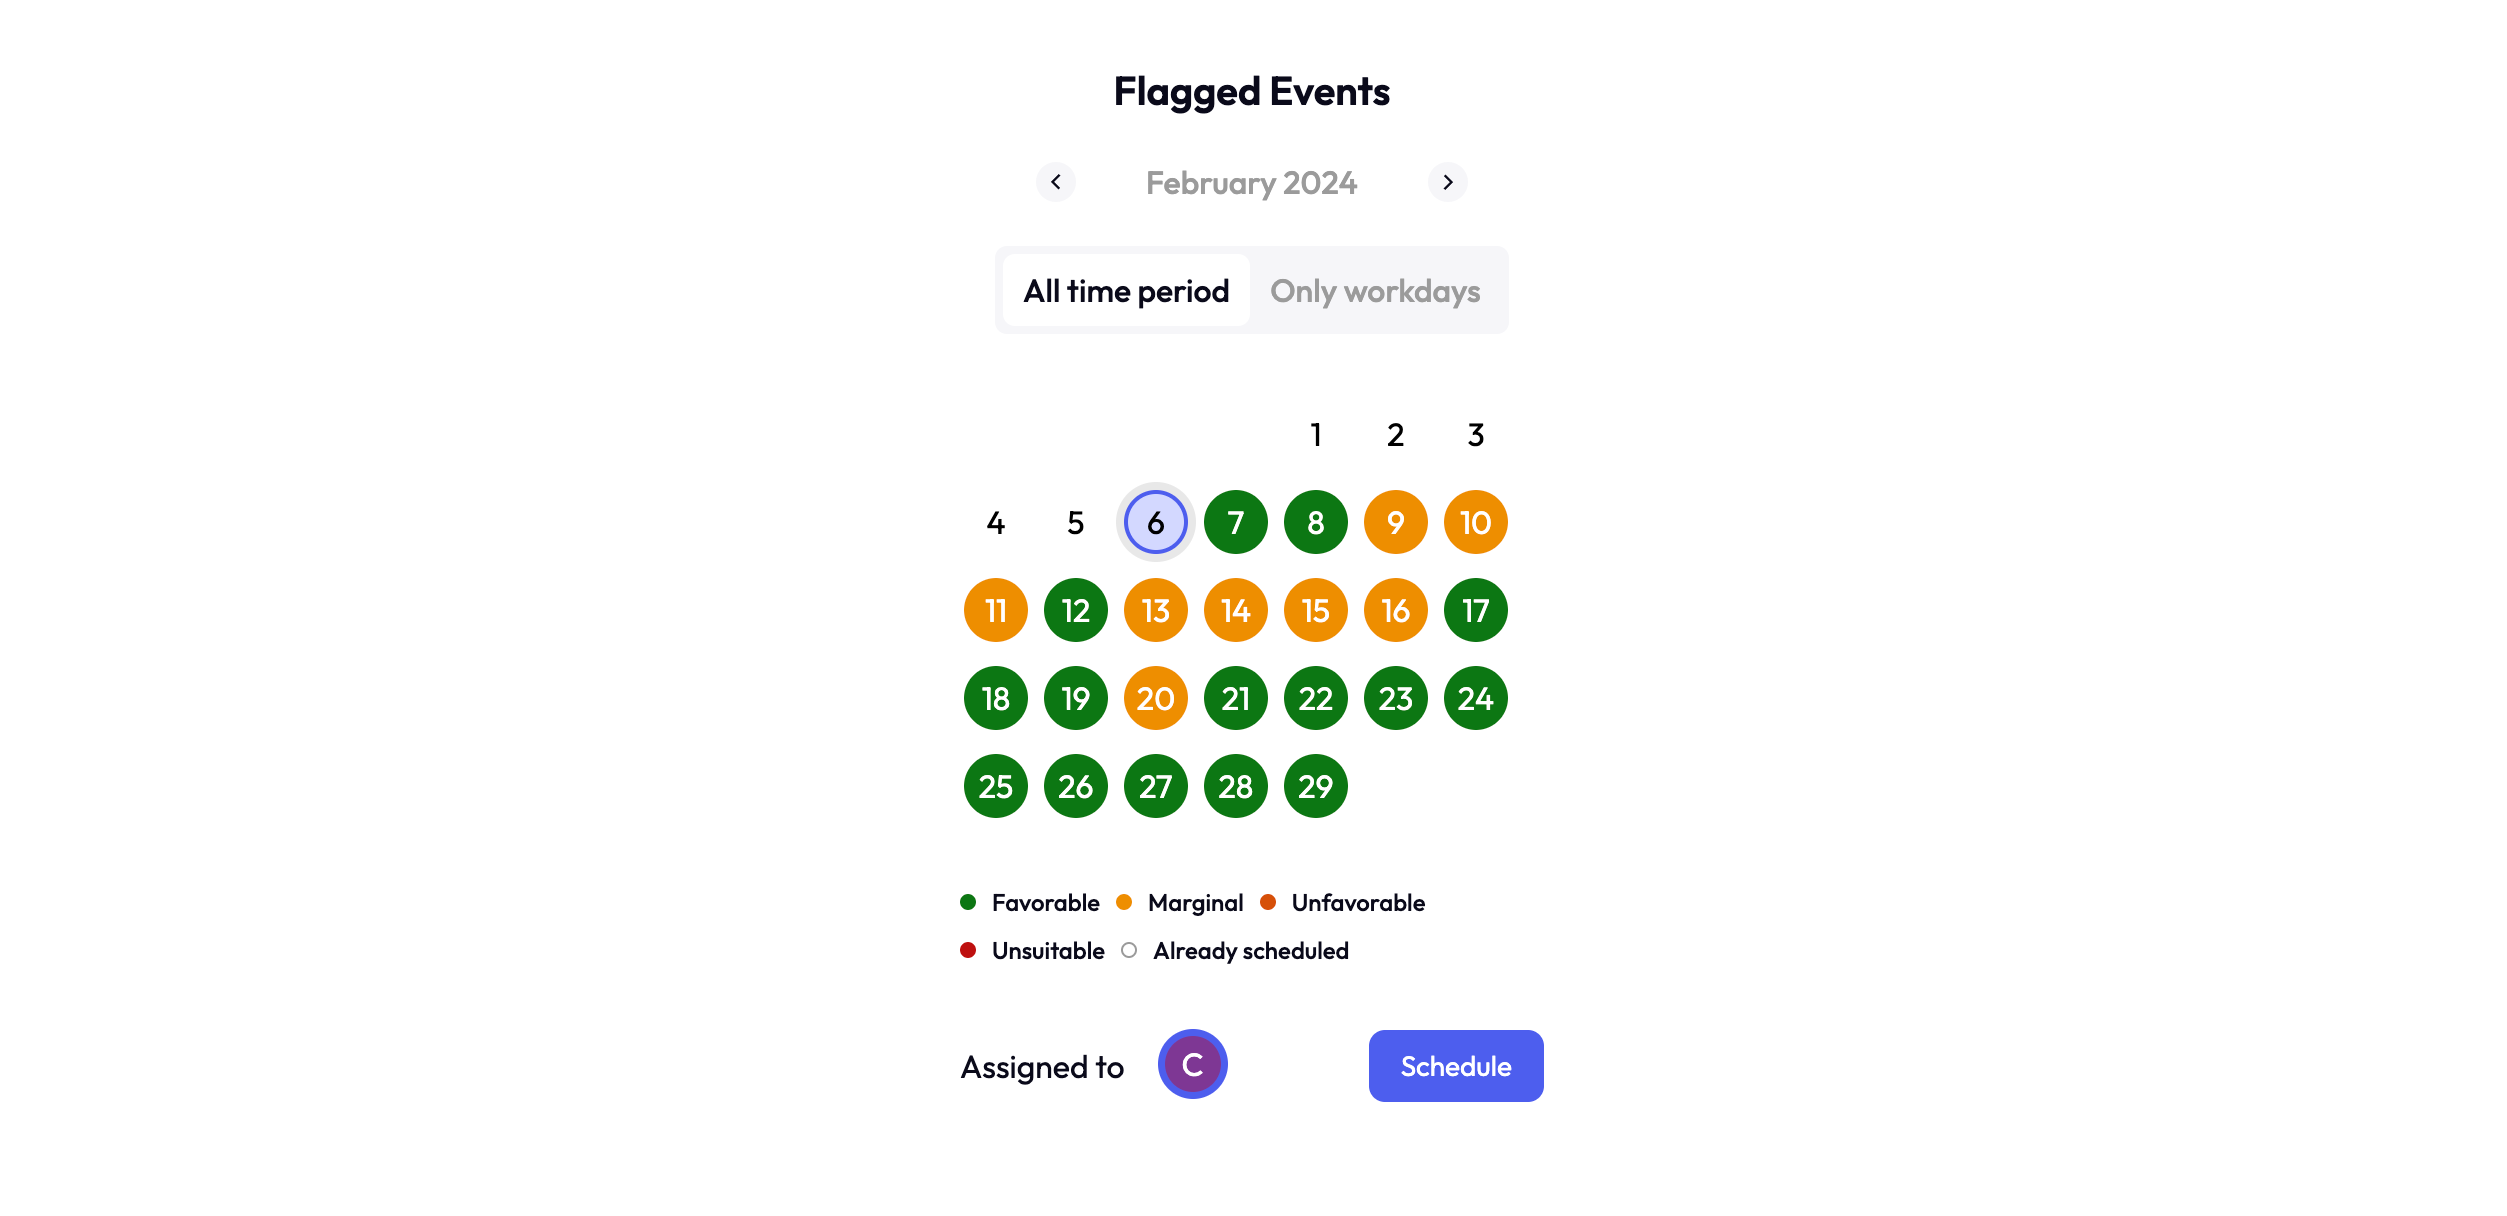
7. The Calendar: Strategic Scheduling Insights
-
Insightful Display: The calendar visualizes average optimality, focusing on the least favorable conditions to prevent surprises. It's designed to give you a worst-case scenario glimpse at a glance, ensuring you're prepared for any weather eventuality.
-
Scheduling Made Simple: To schedule a task, select your desired start and end dates directly on the calendar or enter them manually.
-
Notification and Collaboration: Before finalizing, assign or reassign task responsibilities to keep all team members in the loop. Scheduling triggers updates in your task tracker, streamlining communication and collaboration.
8. Scheduling and Completion: Sealing Your Strategy
-
Efficient Task Management: Once scheduled, your task enters ClimaLinks' dynamic tracking system. It's crucial to revisit and mark tasks as completed, moving them to the archive for historical analysis and future reference.
-
Adaptable Planning: The platform accommodates changes with ease. Should weather forecasts adjust or new information come to light, simply reschedule tasks with a few clicks, ensuring your operations remain agile and responsive to real-world conditions.
-
Archiving Success: Completing and archiving tasks not only keeps your dashboard clean but also builds a valuable dataset for reviewing past decisions and outcomes, enriching your strategic insights over time.